Runnable e-commerce growth engineering tools — not slideware. Each one
runs in the browser from a fresh clone, uses invented sample data, and
links to its source. They're built to show judgment: what to measure,
what to trust, and what to reject.
Acquisition, tracking, catalog ops, AI workflows, automation, affiliate attribution, and infrastructure.
Experimentation & CROLive
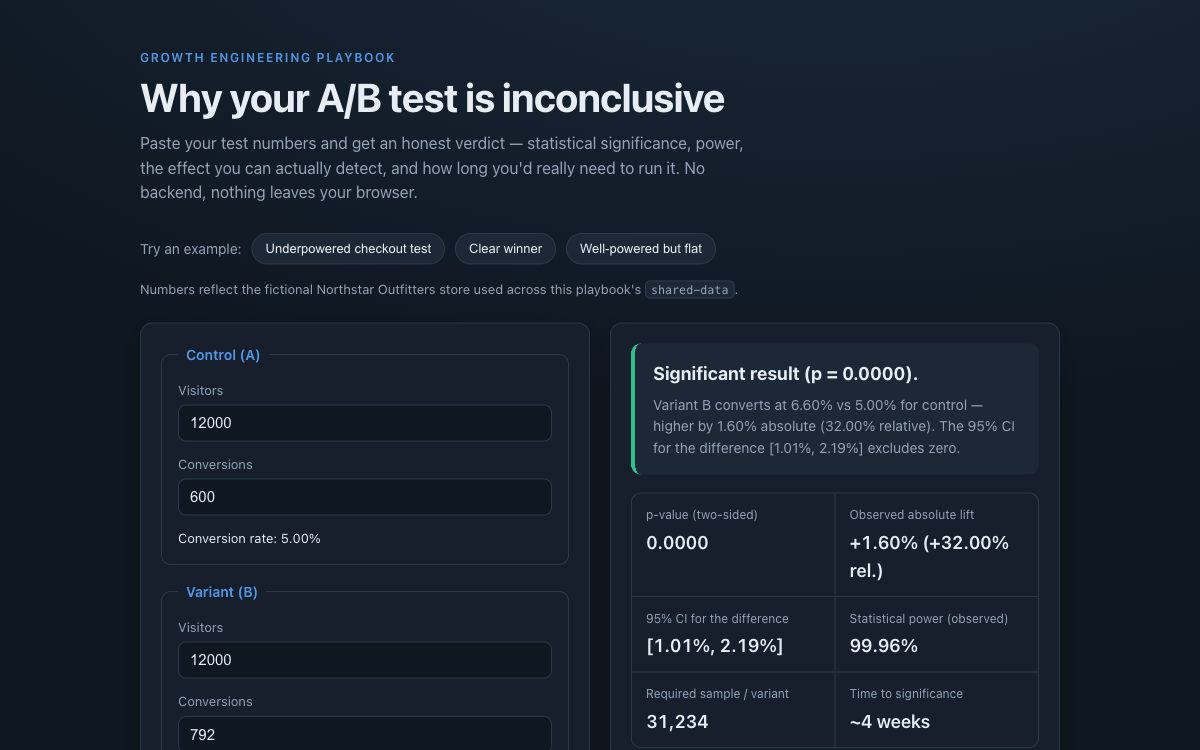
A/B Test Analyzer
Teams call A/B tests too early, on too little traffic — shipping fake winners or killing real ones.
What it proves
Statistical literacy and CRO discipline: significance, power, required sample size, and a peeking simulator — with an honest verdict instead of false certainty.
Business value
Detecting a 10% lift on a 5% baseline needs ~31,000 visitors per variant. The tool shows that gap before traffic and budget are spent on a test that can't conclude.
Broken UTM tags and ROAS-worship quietly corrupt marketing budget decisions.
What it proves
Performance-marketing craft: auditing tracking hygiene, then reframing performance around POAS (profit) instead of vanity ROAS.
Business value
On the sample data it flags €4,806 (18.6% of spend) hidden by missing tags, and a channel at 2.3× ROAS but 0.98× POAS — profitable-looking, actually underwater.
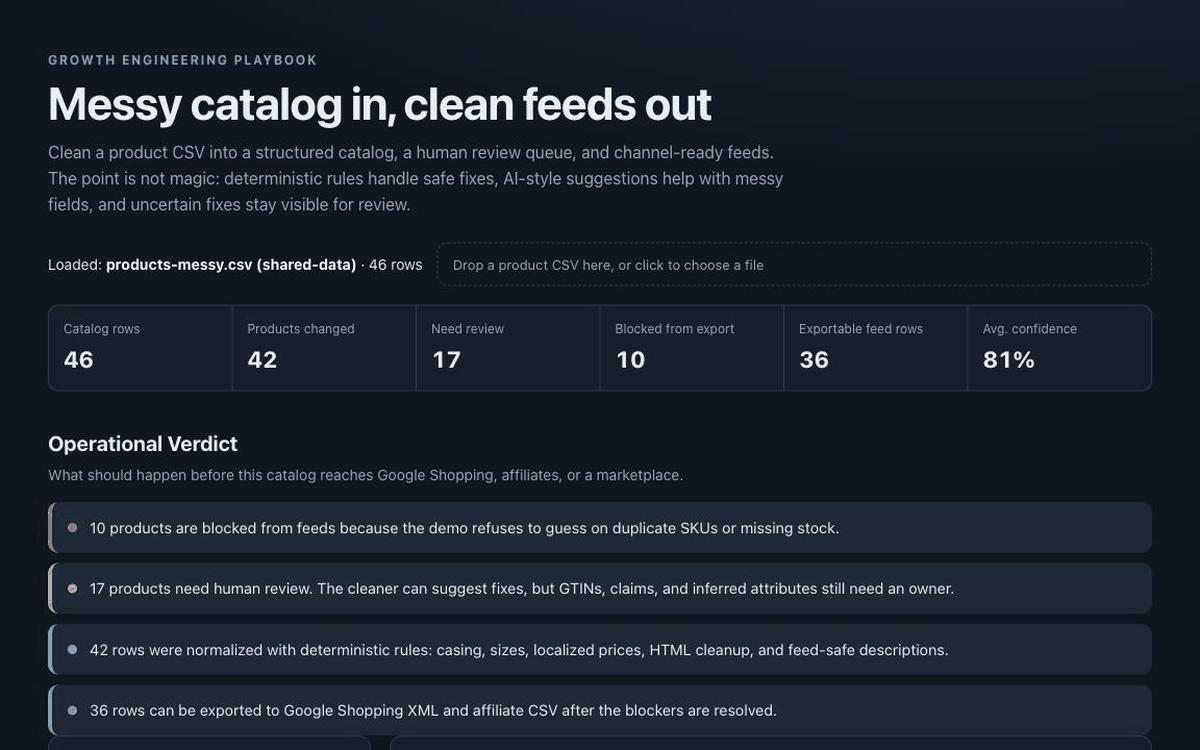
Messy product data breaks feeds, campaigns, marketplaces, and on-site discovery long before anyone notices in a dashboard.
What it proves
Catalog-ops judgment: deterministic cleaning, AI-assisted suggestions, confidence scoring, and human review gates instead of pretending AI can silently fix a product feed.
Business value
On the sample catalog it changes 42 of 46 rows, blocks 10 unsafe exports, and produces 36 feed-ready rows for Google Shopping XML and affiliate CSV — while keeping GTINs, duplicate SKUs, stock, and claims visible for review.
Generic AI product copy creates brand sameness, hallucinated attributes, and product-claim risk.
What it proves
Prompt and workflow judgment: product facts, brand voice, multilingual output, banned-claim rules, length limits, and hallucination checks treated as production requirements.
Business value
Turns structured catalog data into copy-ready EN/DE product content while making missing facts and unsupported claims visible before anything reaches the shop, feed, or marketplace.
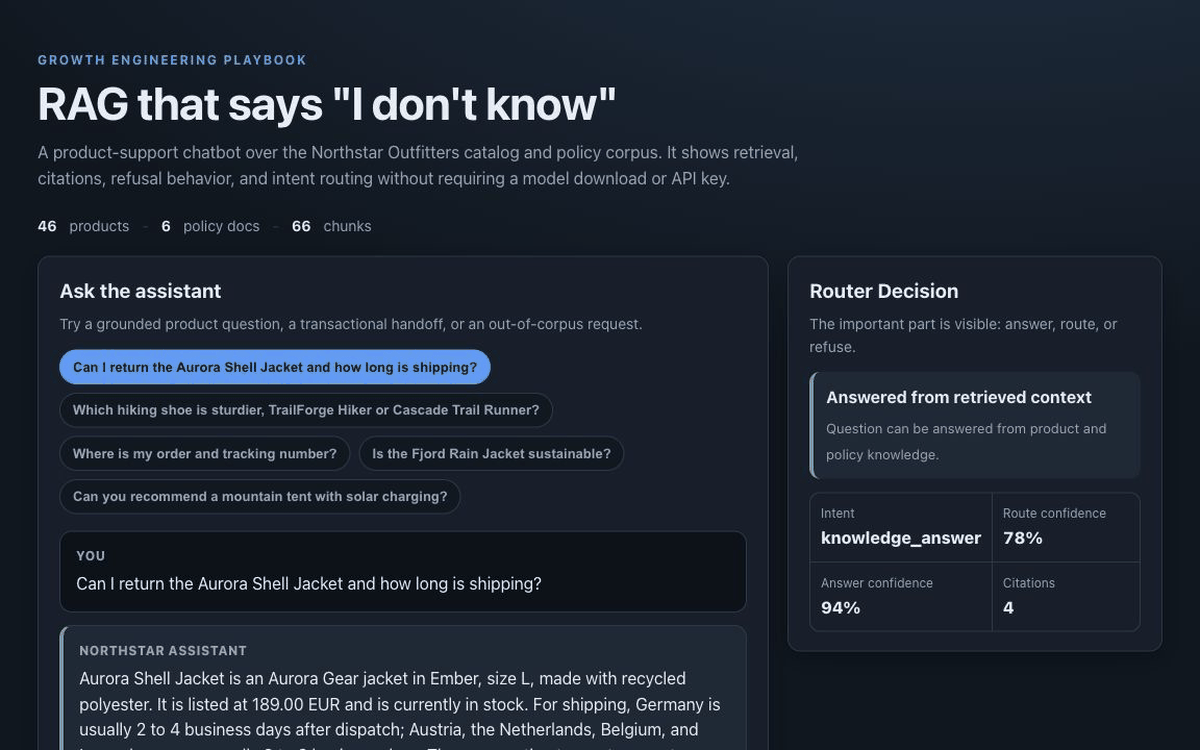
Most chatbot demos answer confidently even when the source data does not support the answer.
What it proves
RAG architecture judgment: retrieval, citations, refusal behavior, and intent routing are visible instead of hidden behind a generic chat UI.
Business value
Keeps product and support answers grounded in catalog and policy data, refuses weak retrieval, and routes order-status questions to a workflow instead of pretending to access live customer data.
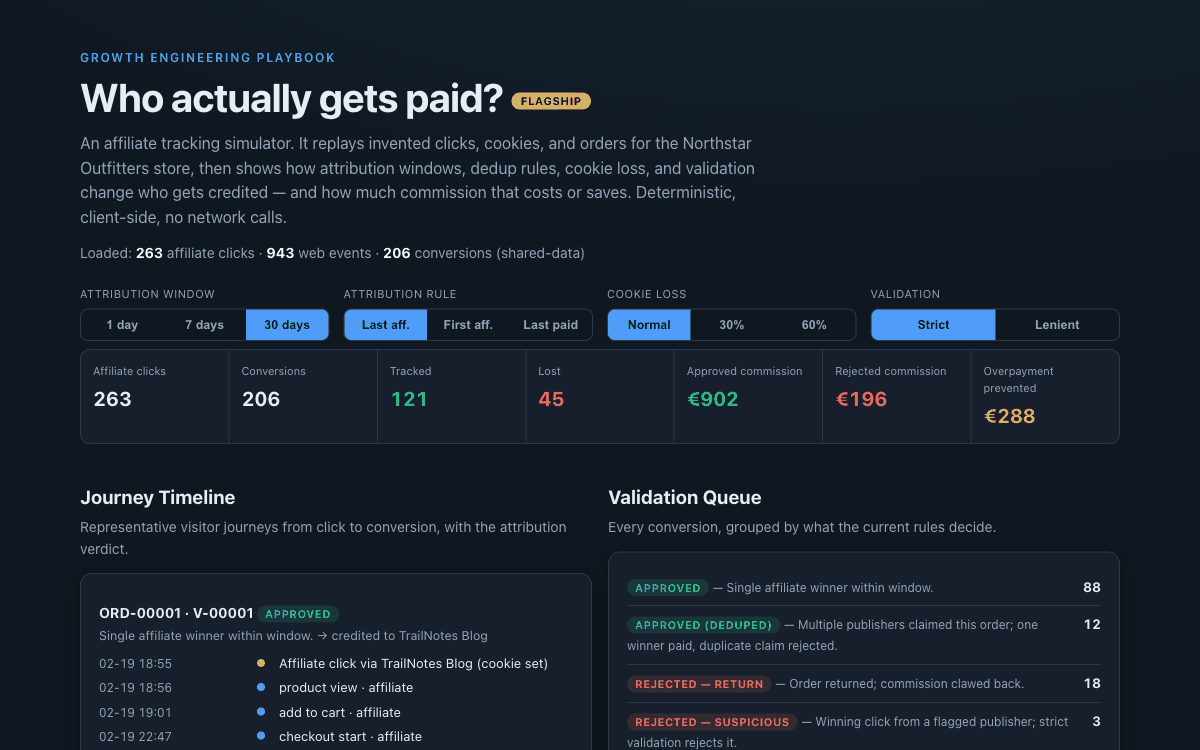
Affiliate tracking breaks in quiet ways: lost cookies, duplicated claims, attribution-window disputes, returned orders, and suspicious click patterns all change who gets paid.
What it proves
Deep affiliate-domain judgment: click IDs, cookies, attribution windows, deduplication, validation, and fraud checks made visible in one inspectable simulator.
Business value
Shows both sides of tracking loss: revenue that gets undercounted when cookies disappear, and commission that gets overpaid when deduplication, validation, or fraud review is weak.
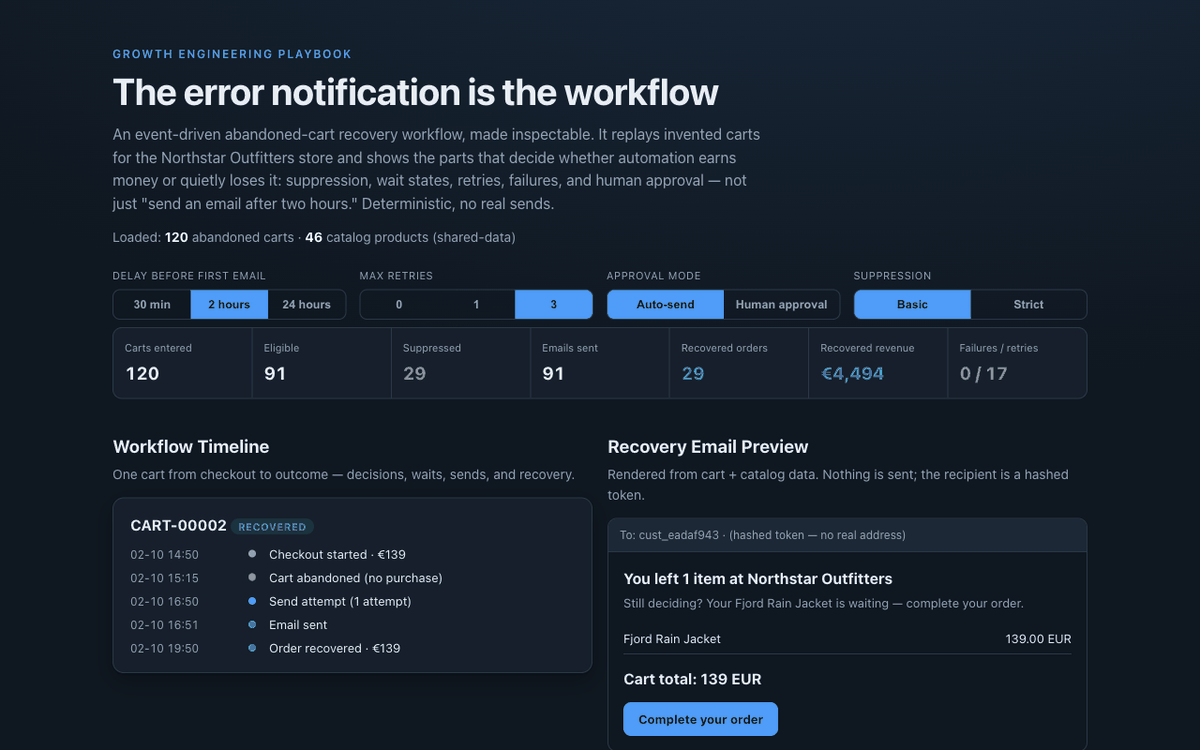
Cart recovery automations often fail silently, send after purchase, ignore consent, or treat retries and errors as afterthoughts.
What it proves
Automation architecture judgment: trigger events, suppression rules, wait states, retries, email rendering, human approval, and operational alerts are treated as one workflow.
Business value
Shows controlled recovery: recovered revenue without bad sends, retries without silent loss, and approval gates for high-value or risky carts.
Customer intelligence: identity, segmentation, retention, lifecycle messaging,
support insights, recommendations, and margin-aware growth. First tool live —
more built on the same shared
Northstar Outfitters sample data.
Customer Data & LifecycleLive
Mini CDP Identity Resolution
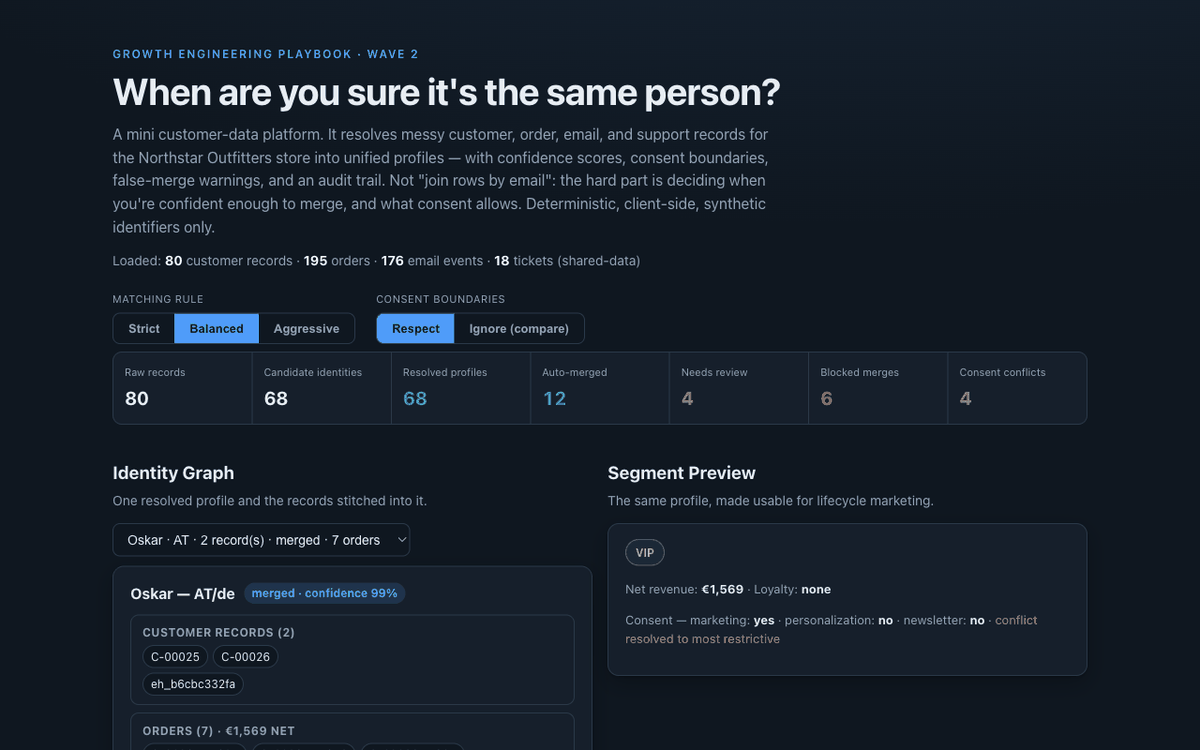
Customer records are messy: duplicate IDs, partial events, conflicting consent, and weak matches turn lifecycle marketing into guesswork.
What it proves
Customer-data judgment: identity resolution with confidence scoring, consent boundaries, false-merge risk, audit trails, and segment-ready profiles.
Business value
Creates trustworthy customer profiles for segmentation and lifecycle campaigns while avoiding duplicate journeys, bad personalization, and privacy-risky merges.
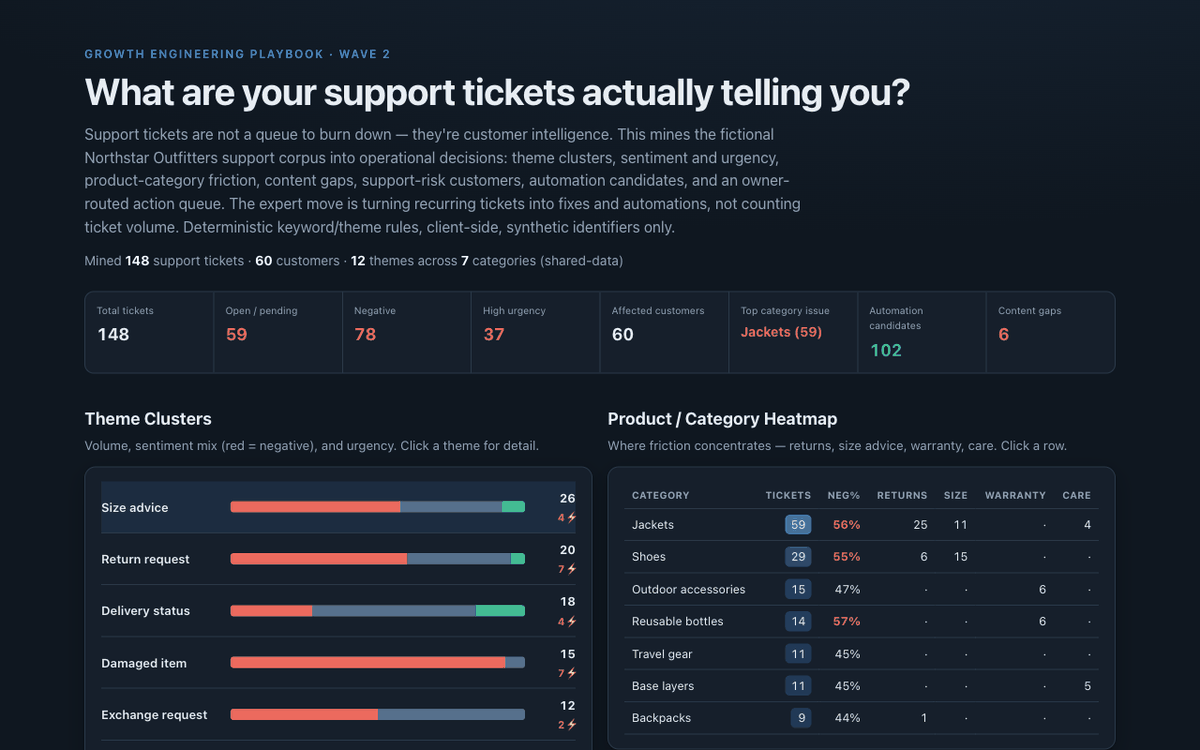
Support tickets often get closed one by one, while the recurring product, content, return, and automation signals stay hidden.
What it proves
Customer-intelligence judgment: ticket themes, sentiment, product friction, content gaps, support-risk customers, and automation opportunities turned into an action queue.
Business value
Helps reduce repeat contacts, improve product pages, prevent returns, prioritize fixes, and route automation opportunities without treating support as a cost-center dashboard.
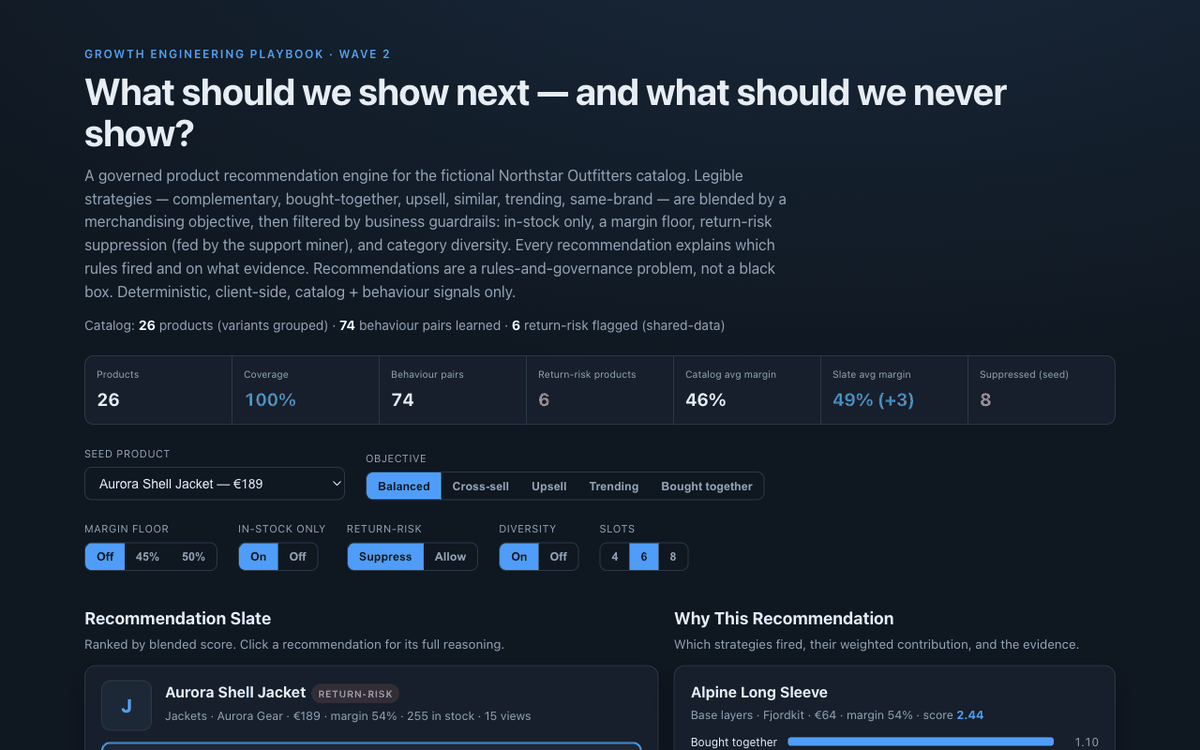
Recommendation widgets happily push out-of-stock, low-margin, or high-return products — with no way to explain why an item is there.
What it proves
Merchandising judgment: legible recommendation strategies blended by objective, governed by business guardrails (in-stock, margin floor, return-risk suppression, diversity), with per-slot explainability.
Business value
Turns a black-box "also bought" widget into a governed, margin-aware slate that won't recommend what you can't ship, can't afford, or keeps getting returned.
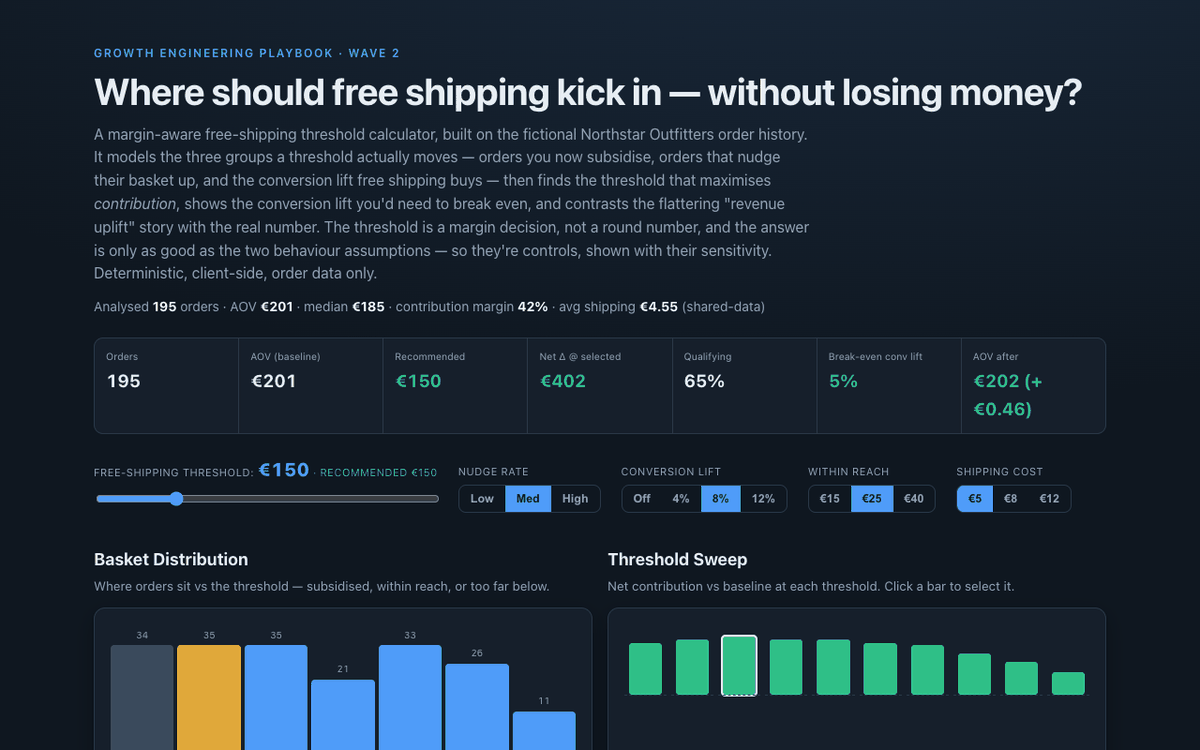
"Free shipping over €50" is usually a round number — set without modeling the subsidy, the basket nudge, or the margin it quietly gives away.
What it proves
Unit-economics judgment: models subsidy, basket nudging, and conversion lift from the store's own basket distribution to find the margin-aware threshold — with break-even analysis and sensitivity to its assumptions.
Business value
Turns a guessed round number into a contribution-margin decision, and exposes the gap between the flattering "revenue uplift" story and the real net contribution.
Content built to be found — and quoted — by AI answer engines: GEO/AEO audits,
structured data, technical SEO, and internal linking. First tool live, more built on the
same shared sample content.
Content & SEOLive
GEO / AEO Content Checker
Most SEO checkers still grade for keywords and links — while AI answer engines quietly skip pages they can't extract a clean, quotable answer from.
What it proves
Content judgment for the AI era: auditing answer-first structure, extractable definitions, quotable sentences, and schema so a page can be quoted by AI Overviews, ChatGPT, and Perplexity.
Business value
Turns "will an AI quote this?" into a concrete score — with the exact sentences a model would lift, the structured data to add, and prioritised fixes.
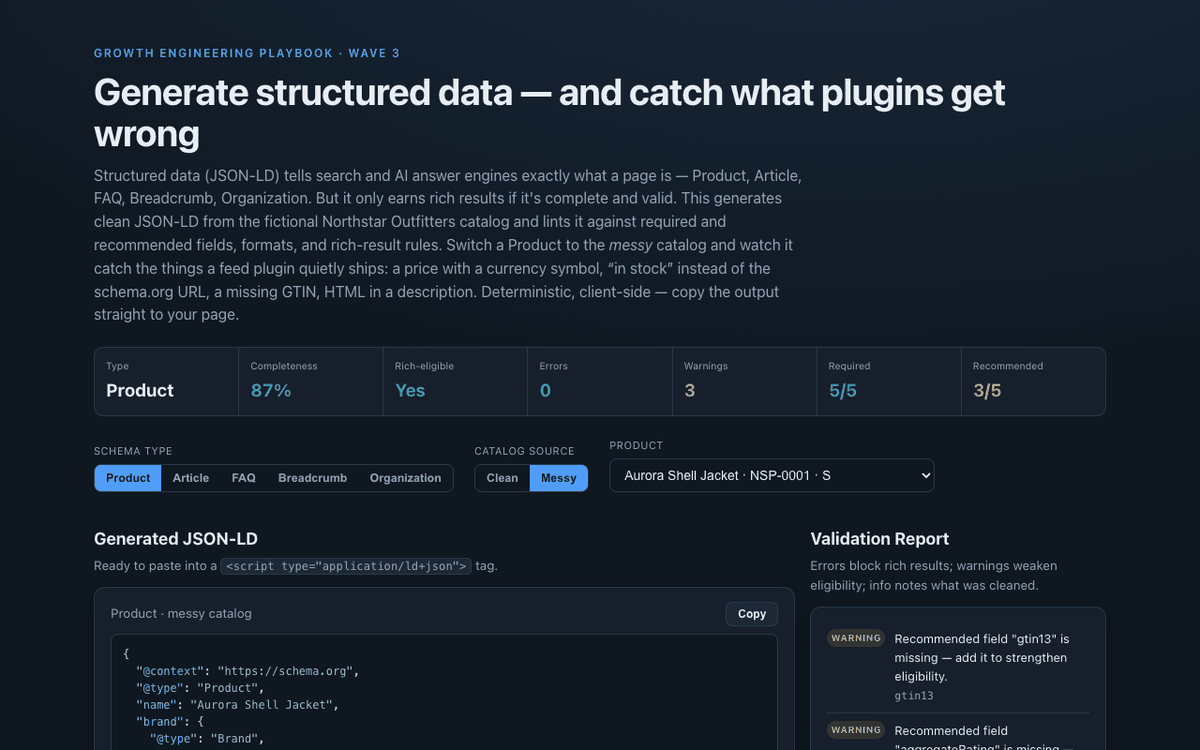
Feed plugins emit JSON-LD that looks present but isn't valid — a price with a currency symbol, "in stock" instead of the schema.org URL — and the rich result silently never appears.
What it proves
Structured-data craft: generating clean JSON-LD (Product, Article, FAQ, Breadcrumb, Organization) and linting it against required/recommended fields, formats, enums, and rich-result rules.
Business value
Turns "we added schema" into "our schema is valid and eligible" — catching, on messy data, the exact mistakes that quietly cost rich results and AI citations.
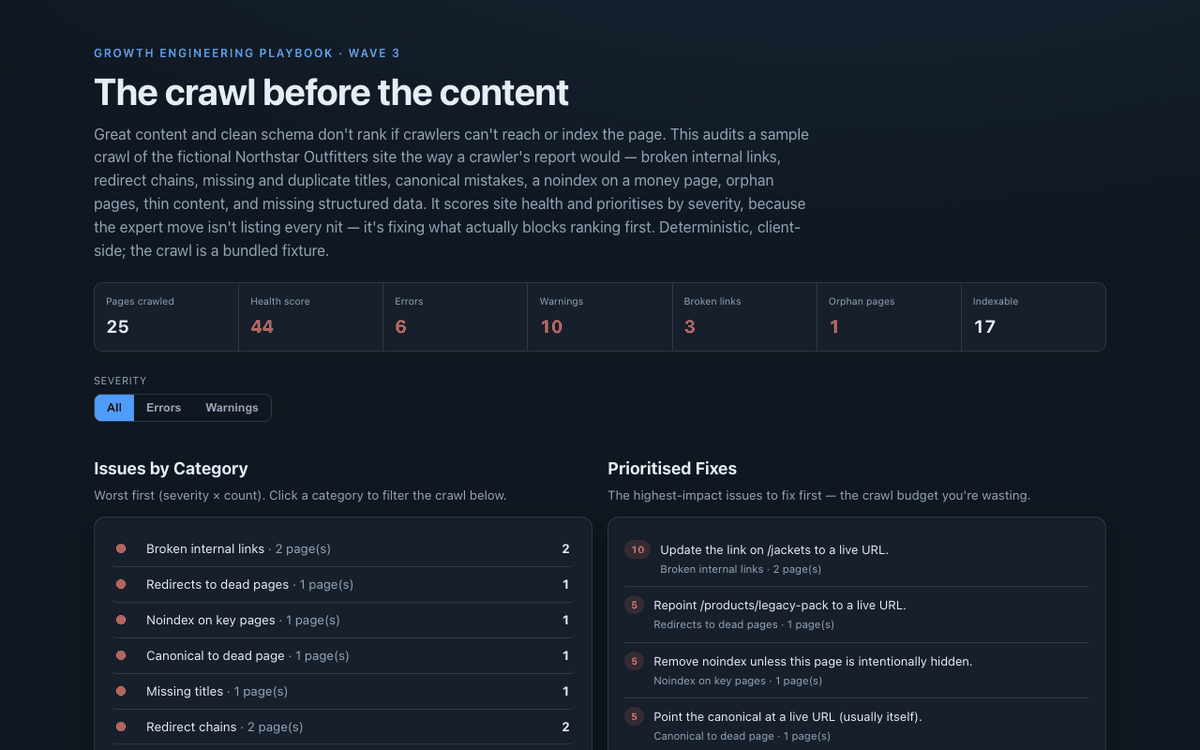
The best content doesn't rank if crawlers can't reach or index it — and most audits bury the three ranking-blockers under fifty cosmetic nits.
What it proves
Technical-SEO triage: crawling for broken links, redirect chains, canonical mistakes, noindex on key pages, orphan pages, thin content, and missing schema — scored and prioritised by severity.
Business value
Surfaces the invisible, ranking-blocking issues (a noindexed product, a canonical to a 404, an orphan page) and orders the fixes by impact — often the highest-ROI SEO work.
Internal linking is treated as an afterthought — leaving orphan pages, under-linked pillars, and related content that was never connected, quietly capping rankings.
What it proves
Site-structure judgment: clustering content by topic, finding orphans and weak pillars, and recommending specific from→to internal links with a reason and an inspectable keyword-overlap strength.
Business value
Turns a pile of pages into a deliberate topical-authority graph — the highest-leverage on-site SEO lever you fully control, lifting whole clusters at once.
The measurement layer that judges everything else: attribution models, consent-mode
impact, channel-mix economics, and incrementality. First tool live, more on the way.
Measurement & AttributionLive
Attribution Model Comparator
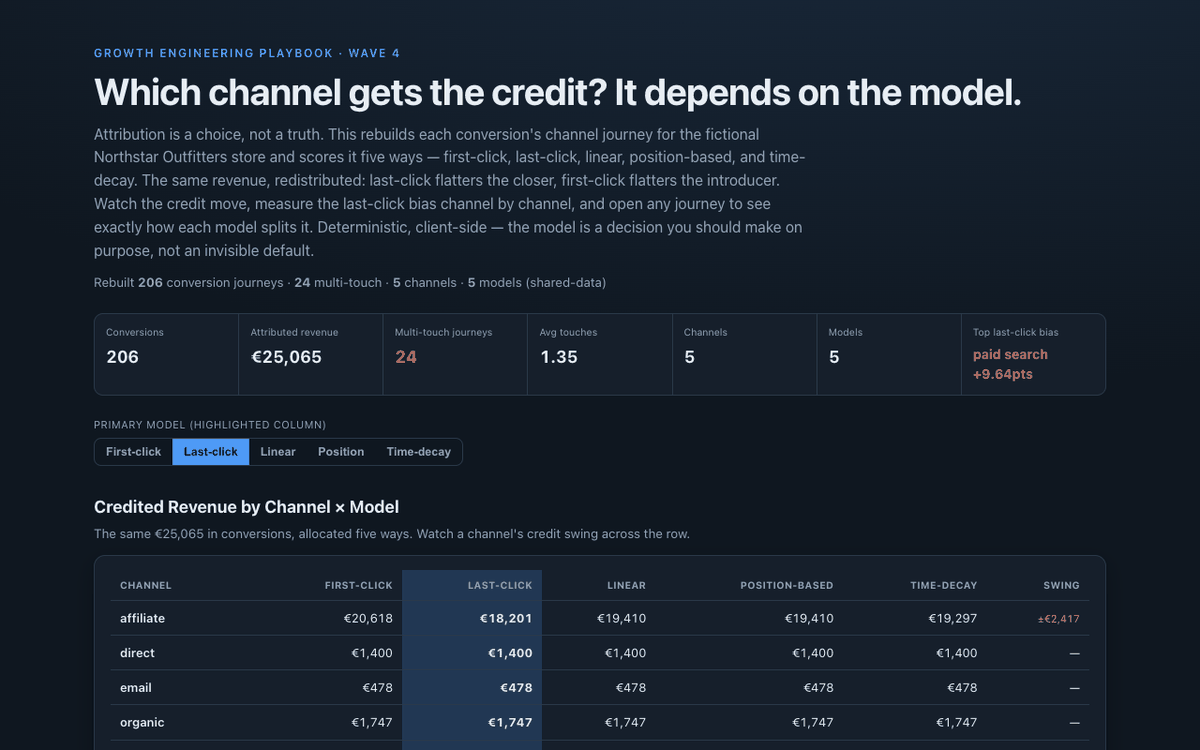
Almost every report runs on last-click by default — a model nobody chose — quietly over-crediting closers and starving the channels that start journeys.
What it proves
Measurement judgment: rebuilding multi-touch journeys and scoring them five ways (first/last/linear/position/time-decay) to show attribution is a modelling choice, with last-click bias quantified per channel.
Business value
Makes the invisible default visible — the same revenue redistributes across channels by model, so budget stops following a number no one decided on.
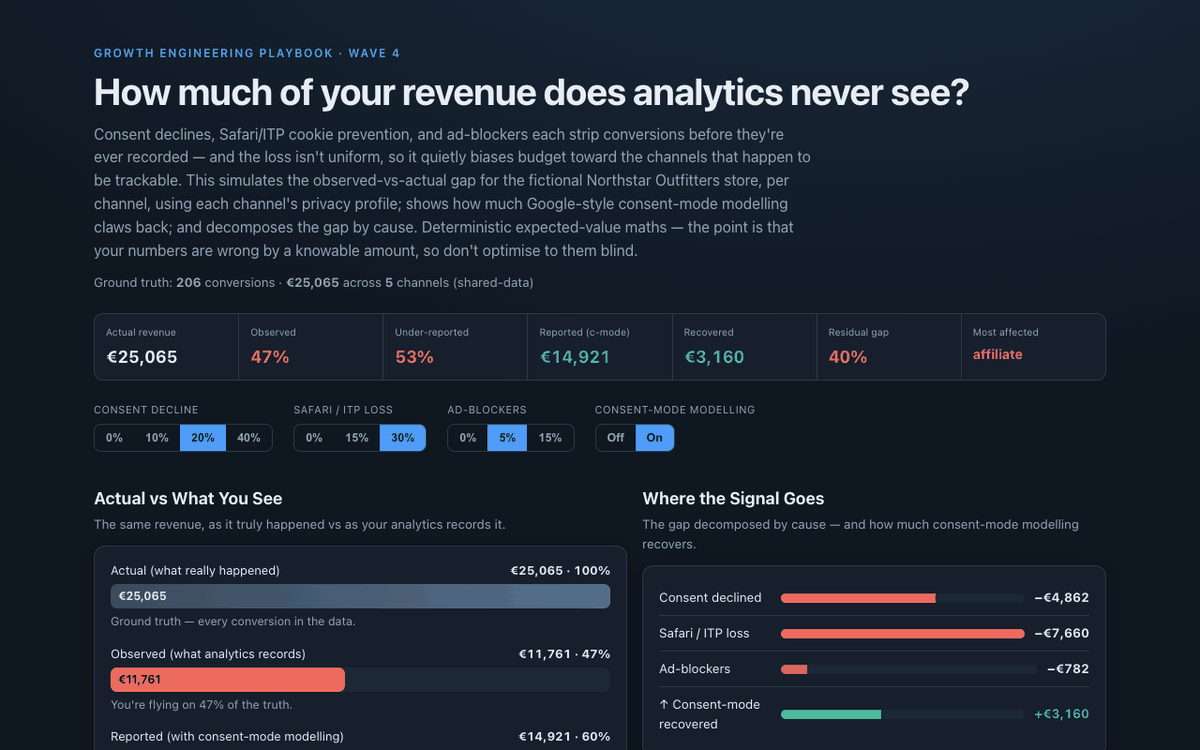
Consent declines, ITP cookie loss, and ad-blockers strip a big, uneven slice of conversions before they're recorded — so teams optimise to numbers that are quietly wrong.
What it proves
Measurement literacy about the data before the model: sizing the observed-vs-actual gap by channel using privacy profiles, decomposing it by cause, and modelling consent-mode recovery correctly.
Business value
Shows how much revenue analytics never sees — and that the loss hits privacy-heavy channels hardest — so budget isn't cut from the channels that are simply harder to measure.
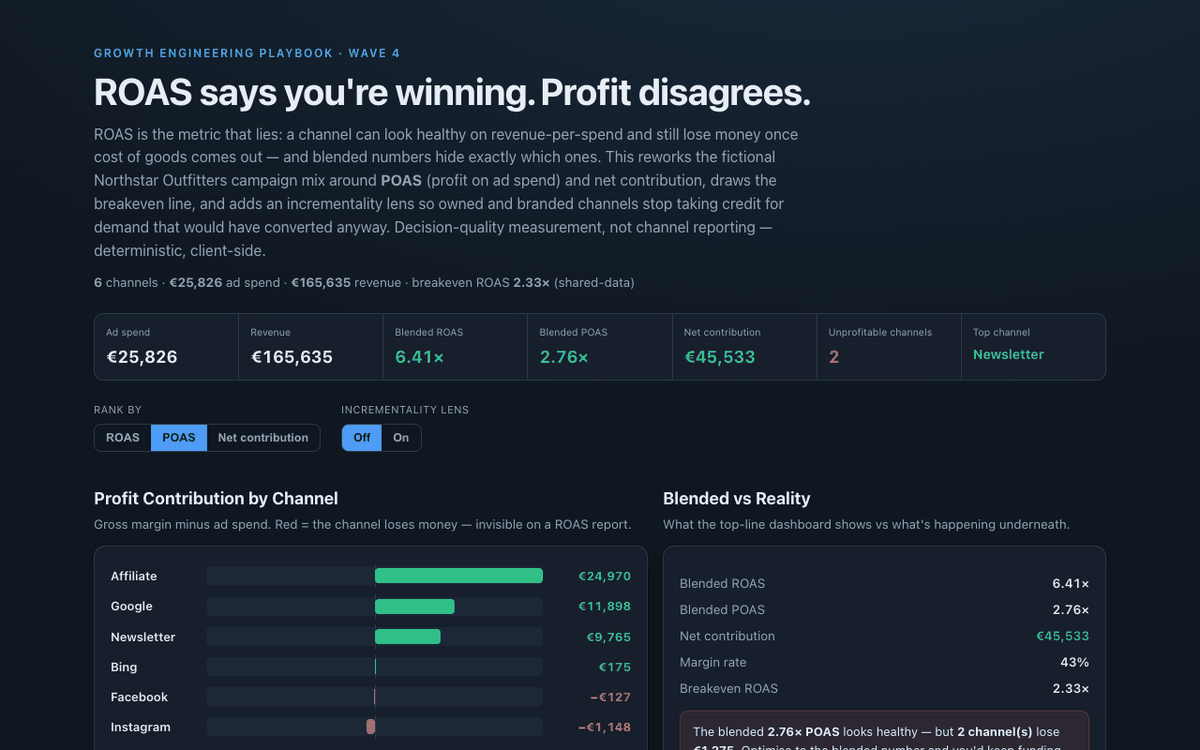
ROAS is the metric that lies — a channel can look healthy on revenue-per-spend and still lose money after cost of goods, while blended numbers hide which ones.
What it proves
Decision-quality measurement: per-channel POAS and net contribution, a breakeven-ROAS line, ROAS-trap flags, and an incrementality lens — profit, not vanity ratios.
Business value
Surfaces the channels quietly losing money under a healthy blended ROAS, so budget scales the real profit engines instead of funding the leaks.
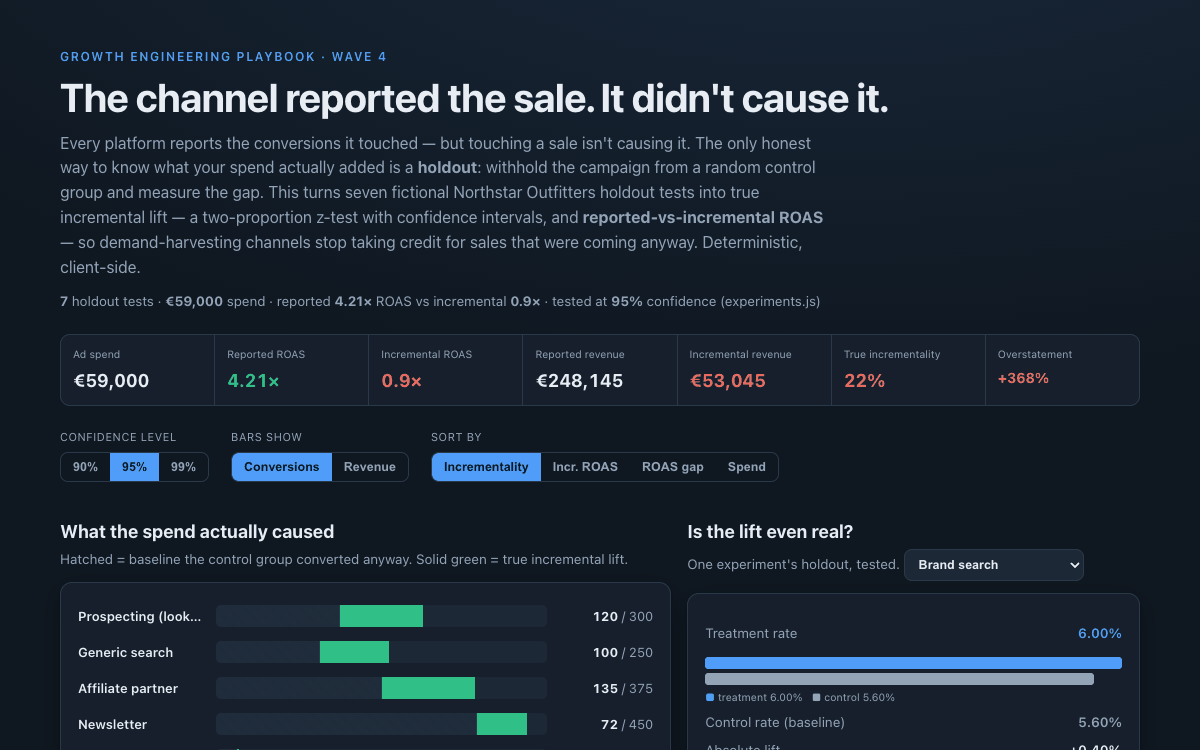
Every platform reports the conversions it touched — but touching a sale isn't causing it. Reported ROAS is inflated for channels that harvest demand that was coming anyway.
What it proves
Causal measurement: treatment-vs-control incremental lift, a two-proportion z-test with confidence intervals, and reported-vs-incremental ROAS — with a well-powered null told apart from an underpowered one.
Business value
Exposes the channels whose great reported ROAS collapses under a holdout, so budget moves toward what actually causes growth instead of paying for demand you already own.
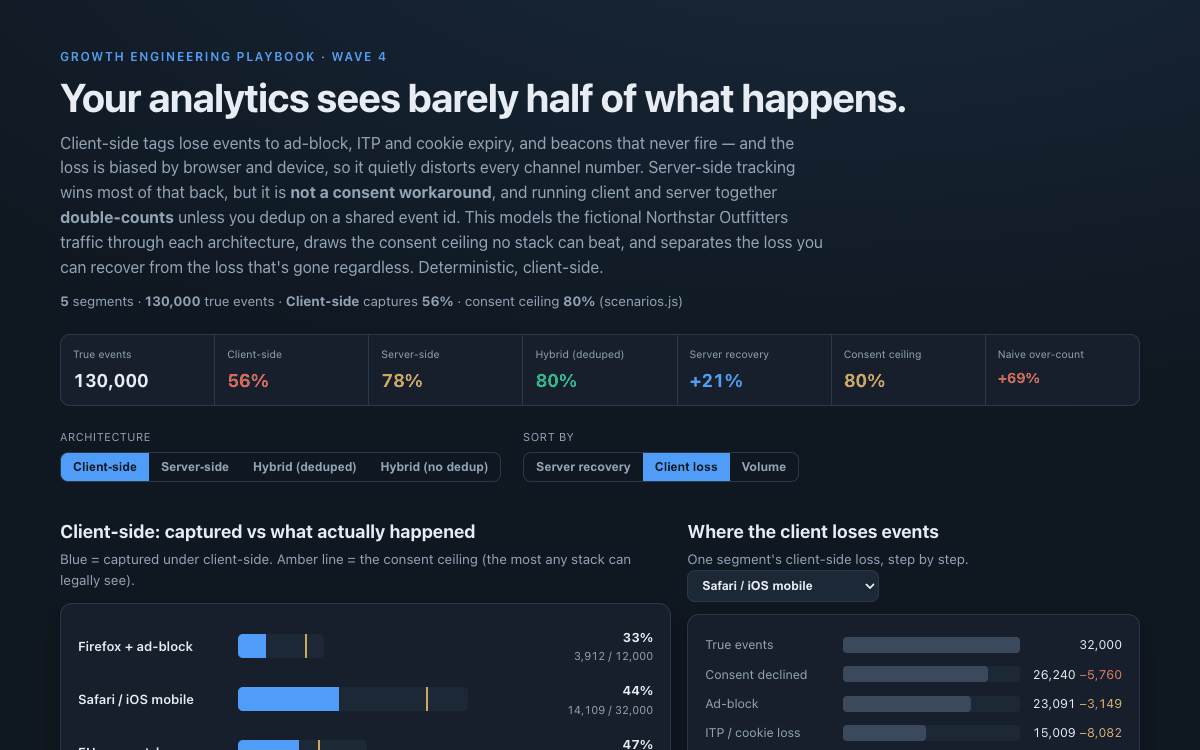
Client-side tags lose events to ad-block, ITP and dropped beacons — unevenly by browser and device — so every channel number is quietly distorted by how users browse.
What it proves
Measurement-architecture judgment: client loss vs server-side recovery, the consent ceiling no stack can beat, and the double-count a naive hybrid reports without event-id dedup.
Business value
Shows where server-side is worth the effort and where consent is the wall — and stops a hybrid rollout from inflating every conversion by double-counting.
The decision layer on top of honest measurement: LTV and CAC, payback, budget
allocation, forecasting, and cohort projection — turning trustworthy numbers into
where the money goes.
Planning & Unit EconomicsLive
LTV / CAC / Payback Calculator
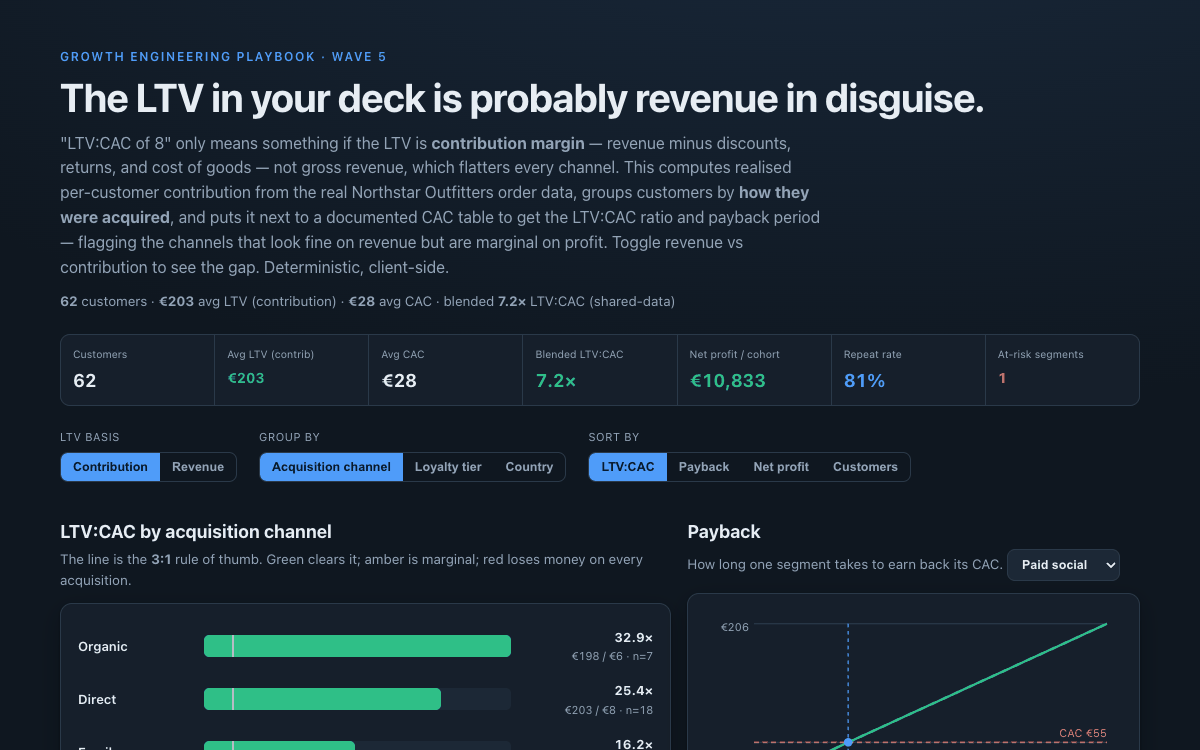
"LTV:CAC of 8" only means something if the LTV is contribution margin, not gross revenue — which flatters every channel by the discounts, returns and cost of goods it hides.
What it proves
Unit-economics craft on real order data: contribution-margin LTV by acquisition channel, LTV:CAC against the 3:1 rule, payback curves, and the revenue-vs-contribution gap as a toggle.
Business value
Turns acquisition budget into a defensible conversation — fund the paid channels that clear 3:1 with fast payback, cap the marginal ones, and never let revenue-based LTV justify the spend.
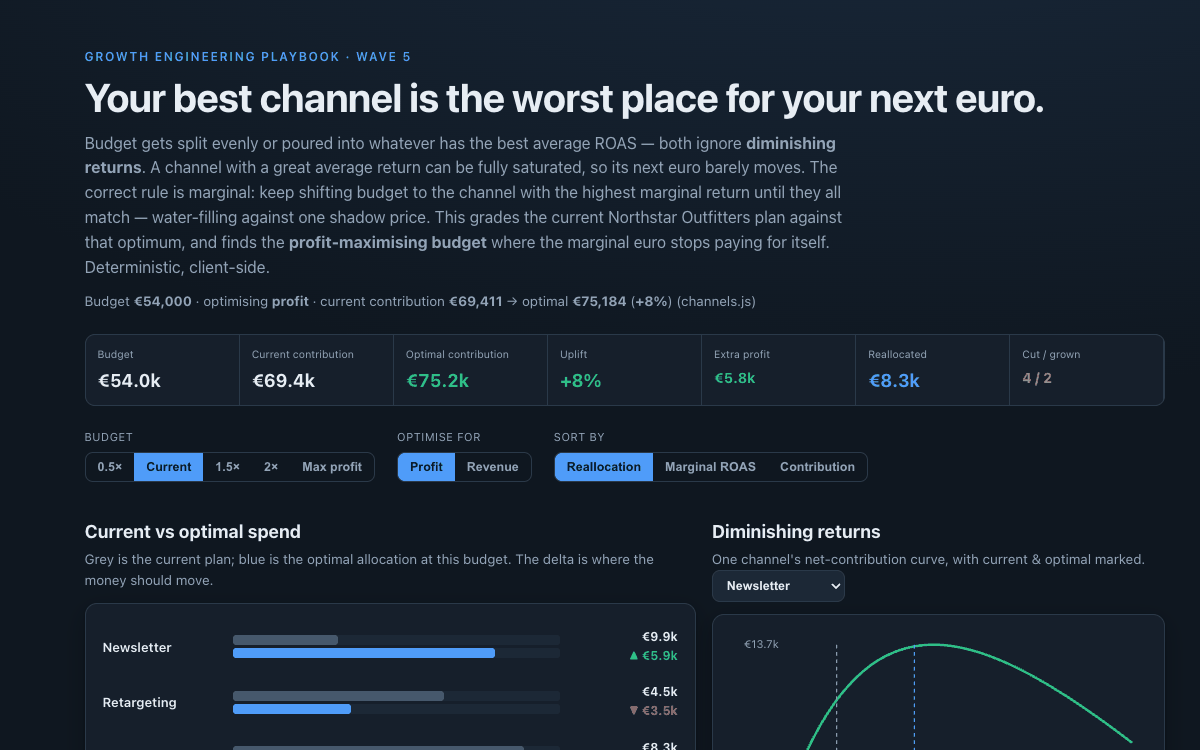
Budget gets split evenly or poured into the best average ROAS — both ignore diminishing returns. A saturated channel's next euro barely moves, so average ROAS allocates backwards.
What it proves
Marginal thinking made concrete: water-fill spend across diminishing-returns curves so every funded channel shares one marginal return, plus the profit-maximising budget and a profit-vs-revenue objective.
Business value
Finds the reallocation that lifts profit from the same budget — cut the saturated channels, fund the ones still on the steep part of the curve — and the point where the next euro stops paying.
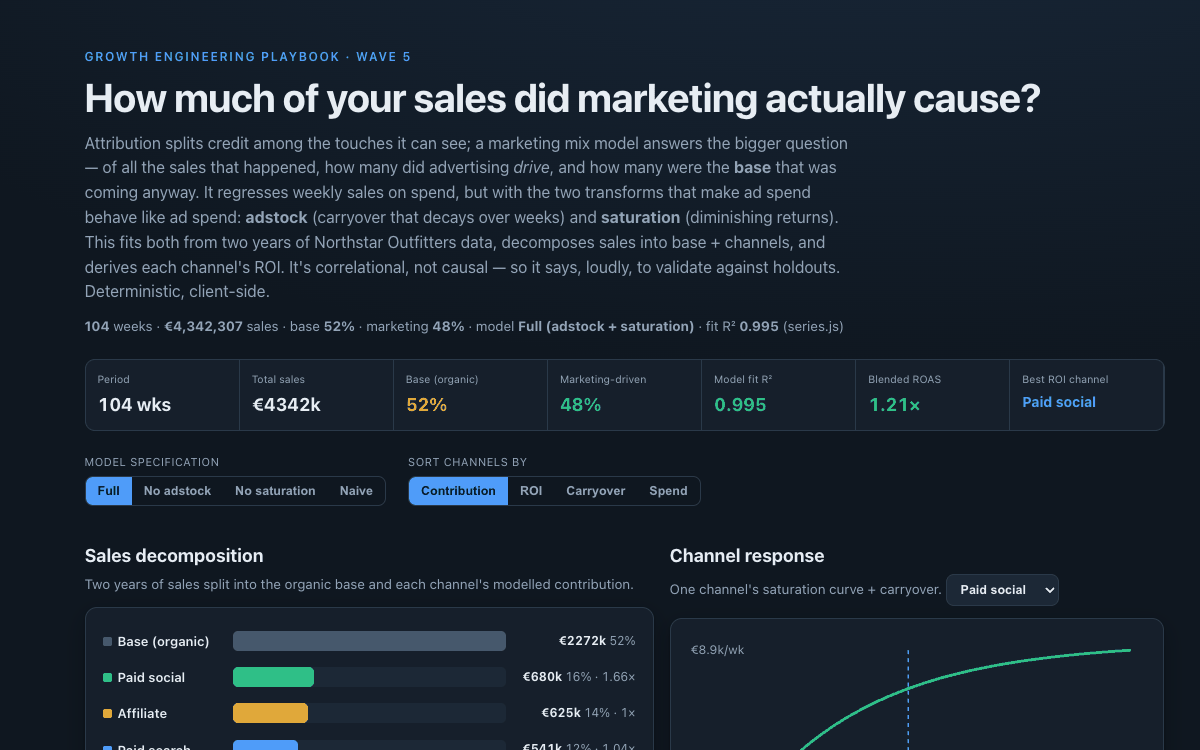
Of all the sales that happened, how many did marketing actually cause — and how many were the base coming anyway? Naive regressions ignore carryover and diminishing returns and mis-read both.
What it proves
A from-scratch MMM: adstock (carryover) + saturation transforms, grid-searched carryover, and an OLS fit that decomposes sales into base vs channels with per-channel ROI, response curves, and fit R².
Business value
Sets budget when you can't track users end-to-end — separates organic base from marketing-driven sales, values carryover, and hands calibrated response curves to the allocator (validated against holdouts).
Planning runs on a single revenue number presented as fact — with no range, and no check on whether the model is off by 3% or 30%. A forecast without a range is a guess in a suit.
What it proves
Forecasting done honestly: log-linear trend + monthly seasonality by OLS, prediction intervals that widen with the horizon, and a backtest reporting MAPE and interval coverage.
Business value
A plan-ready forecast with a defensible range and a stated error bar — plan the near term tight and the far term loose, and size inventory and cash to the seasonal swing averages hide.
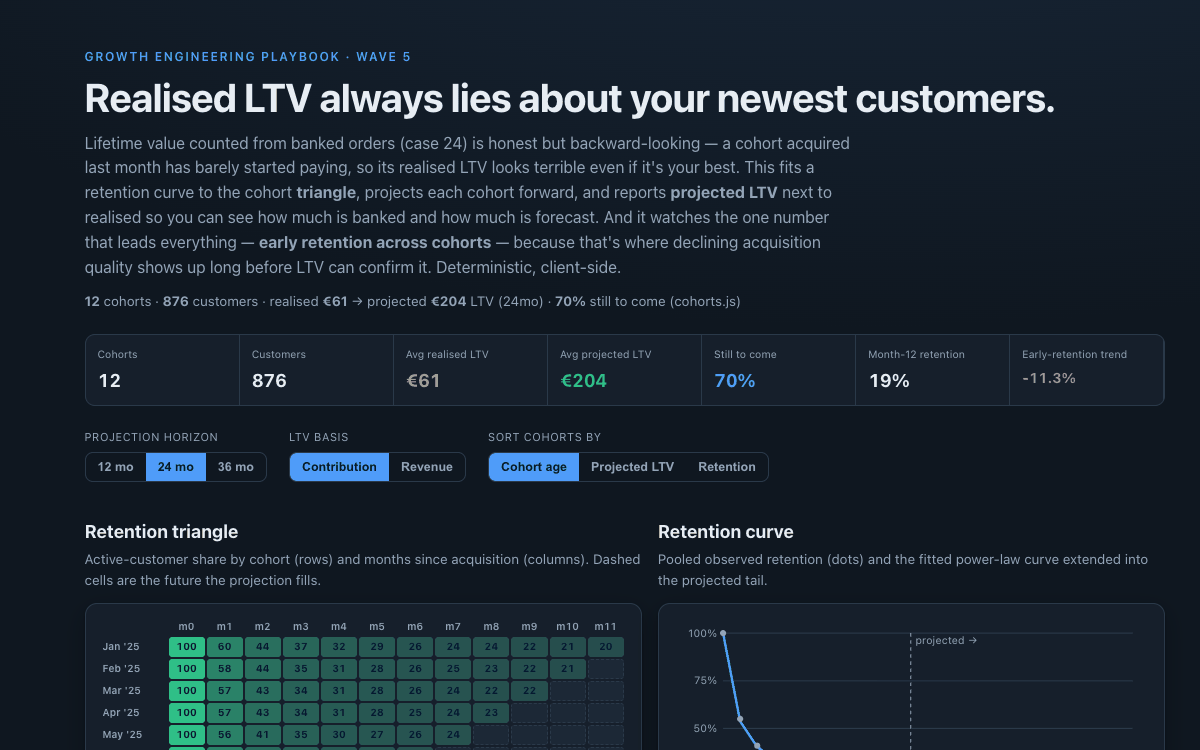
Realised LTV always libels your newest customers — a cohort acquired last month has barely started paying, so its banked value looks dismal even if it's your best-retaining ever.
What it proves
Cohort analysis done properly: fit a power-law retention curve to the cohort triangle, project each cohort's tail, and report realised vs projected LTV plus the month-1 retention trend that leads quality.
Business value
Gives acquisition the number it needs — projected, not banked, LTV — so good paid channels aren't killed on a payback report, and flags declining acquisition quality months before LTV can.